Our Data
-
Background
The task of data collection begun after the research problem was identified and the methodological framework was structured. Our researchers collected and analysed all the data used by the PVDATA software platform. Our data is categorised into 3 segments: primary data, secondary data, and tertiary data. Our primary datasets were sourced from credible third parties’ organisations such as the World Bank, Bloomberg, NASA and more. Our secondary datasets were sourced by purchasing live API data such as Geographical Information Systems (GIS) data from Google, financial and currency data from Trading Economics and more. Our tertiary datasets were sourced directly from the end user through stakeholder workshops, customer interviews, academic journals and more. Over the course of the data collection process, we reviewed more than 60 peer reviewed academic journals, conducted over 700 stakeholder workshops, and communicated directly with more than 1,000 solar energy professionals. -
Methodological approach:
Our researchers designed a unique framework that incorporates both quantitative and qualitative metric data to derive a useful practical output. The conceptual model presented below on Fig 1.0, shows a graphical representation of how our existing user input parameters integrate a tried and tested energy modelling simulation concept for building digital tools. From this illustration, the key outputs we intend to derive are: 1). A comprehensive environmental, technical, and financial report assessing the viability of solar PV grid projects anywhere in the world, 2). A detailed and well-structured debt finance cash flow model for solar energy investments.
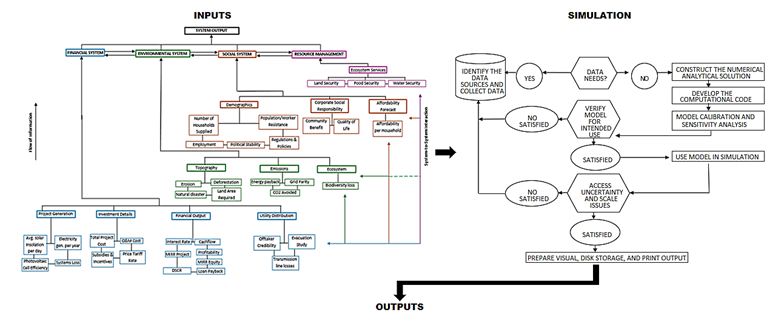
Fig 1: Conceptual Model
-
Identifying the indicators:
-
PVDATA indicator selector was categorised into 3 segments. 1). Financial indicators, 2). Technical indicators, 3). Environmental, Social and Governance indicators (ESG). As incorporating qualitative ESG indicators to our software was important to us, we followed the following sustainable frameworks for identifying ESG: UN Principles for Responsible Investment (PRI) framework and Sustainability Accounting Standards Board (SASB) framework.
Over 50 unique indicators were identified and incorporated to the PVDATA software. Some of the indicators identified and used on PVDATA are Flood data, Internal rate of return (IRR), Energy affordability, biodiversity risk, regulatory policy risks, levelized cost of energy (LCOE) and many more.
-
Primary and secondary data:
-
Our primary and secondary datasets are all opensource and available to the public. It was important to us that we retrieved these datasets from credible organisations with a strong track record of data integrity and data accuracy. As such, we focused on the following organisations for all our opensource datasets: the world bank, NASA, Google, Trading Economics, the European Union, the United Nations, Imperial College London, Bloomberg, Global Forest Watch, Climate Investment Fund (CIF) and others. Below on table 1, is a further breakdown on where our selected datasets are retrieved from:
Table 1: Primary dataset
Data Type Indicator Regular Updates Source Geographical Location coordinate API Daily Google Temperature data Daily NASA Irradiance data Daily NASA Rainfall data Daily NASA Flood risk API Daily NASA, Imperial College London Financial Currency Names Daily The World Bank Currency exchange rates Daily Currency freaks Interest rate API Daily Trading Economics Corporate tax API Daily Trading Economics GDP/Capita data Annually The World Bank Utilities Electricity utilities data Quarterly Bloomberg, European Commission, Statista, Individual country database on electric utility. Power market data Quarterly European Commission, Individual country database on electric utility (see country list). Electricity consumed per household Quarterly The World Bank, world data, Individual country database on electric utility. Electricity affordability index Quarterly The World Bank Environmental/ Social Biodiversity risk Annually The World Bank, Imperial College London Grid carbon intensity data Annually Ecometrica Population data Annually The World Bank Sustainable land use index Annually Imperial College London Natural disaster risk Annually weltrisikobericht.de Regulatory policies Quarterly IEA, UNFCCC, Bloomberg, Climate Investment Fund (CIF). Deforestation Annually Global forest watch -
Tertiary data:
-
Our tertiary data category sourced data directly from solar energy stakeholders in the form of interviews, workshops or academic journals or articles. For this process, we conducted and or read over 1,000 interviews, workshops, and journals collectively. The main goal for this category was to know what is going on in the solar energy market from all the different viewpoints across the world. For example, how does a policy framework for solar in the United States affect profitability, or how does an environmental protection policy in Brazil affect market players in the region. This is very key to the PVDATA software, to ensure validity and real time data reporting derived from our software. Some of the journals and stakeholder workshops we covered to retrieved useful datasets are highlighted on table 2. The table is classified into five groups: Journal Paper (JP), Energy Financial Models (EFM), Official Reports (OR), Stakeholder interviews (SI) and other which refers to reviews from solar trade associations. Furthermore, data from official reports (OR), were retrieved predominantly from the International Energy Agency (IEA), the World Economic Forum (WEF) and the United Nations (UN).
Table 2: Tertiary data
Source
Year
Country
JP
EFM
OR
INT
OTHER
C1
C2
C3
C4
Hernandez et al.
2014
USA, Spain
×
×
Powell & Bender
2009
Canada
×
×
Schaeffer & Szklo
2005
Brazil
×
×
×
×
Wescott
2011
USA
×
×
Tsoutsos & Frantzeskaki
2005
Greece
×
×
×
World Bank
2013
USA
×
×
SolarCentury
2016
UK
×
×
Vera & Langlois
2007
Austria
×
×
×
×
Evans & Strezov
2009
Australia
×
×
×
×
Quaintglobal
2016
Nigeria
×
×
Stamford
2012
UK
×
×
×
×
×
Martínez
2013
Croatia
×
×
×
×
NREL
2015
USA
×
×
×
IRENA
2012
Germany
×
×
European Commission
2011
Belgium
×
×
Low Carbon
2016
UK
×
×
Liu
2014
China
×
×
×
×
Tejeda & Ferreira
2014
USA
×
×
Phillips
2013
UK
×
×
×
Green-Giraffe
2016
UK
×
×
Wahid
2016
India
×
×
World Economic Forum, n.d.
2013
Switzerland
×
×
×
×
EPIA
2010
Belgium
×
×
FirstSolar
2016
Brazil
×
×
Ngan & Tan
2012
Malaysia
×
×
Prakash & Bhat
2009
India
×
×
Juwi
2016
Germany
×
×
Kemmler & Spreng
2007
Switzerland
×
×
×
×
PWC
2015
UK
×
×
×
Evans et al.
2009
Australia
×
×
×
×
D’Amico & Petroni
2015
Italy
×
×
Raadal & Vold
2014
Norway
×
×
Ngan & Tan
2012
Malaysia
×
×
Mann & Teilmann
2013
Denmark
×
×
Leung & Yang
2012
China
×
×
Augusta&Co
2016
UK
×
×
Sciences
2007
USA
×
×
Tabassum & Premalatha
2014
India
×
×
×
Saidur & Rahim
2011
Malaysia
×
×
Dai & Bergot
2015
China/USA
×
×
Kunz et al.
2007
USA
×
×
Oliveira & Fernandes
2011
Portugal
×
×
Zhang
2010
USA
×
×
Bidwell
2013
USA
×
×
×
×
Kaldellis
2005
Greece
×
×
Wustenhagen & Wolsink
2007
Switzerland
×
×
Enevoldsen & Sovacool
2016
Denmark
×
×
Gallego & Carrera
2010
Germany
×
×
D’Souza & Yiridoe
2014
Australia
×
×
Khorsand & Kormos
2015
Canada
×
×
Fielding & Whitfield
2006
UK
×
×
Torres Sibille
2009
Spain
×
×
-
Default Values Assumptions:
-
The PVDATA software allows users to select system default values which are fetched from our API directly to the user’s dashboard. Although we do prefer users entering their own unique input parameters to get a more bespoke output of their solar energy investment, we give the user the option of requesting for data they do not have or not too familiar with by clicking on our system default toggle on the PVDAT software. Table 3 below gives the source of the data.
Table 3: Default data
Data
Number of Sources
Main source Retrieved
Type of Storage on PVDATA
Number of countries
Solar cost per MW ($USD)
25
Bloomberg
Server
Global
Land size per MW (Ha)
70
NREL
Server
Global
Photovoltaic Design
151
NREL
Server
Global
Financing structure
214
PWc
Server
Global
Operation
51
Juwi Solar
Server
Global
Live API Fetch
1
Trading Economics
Server
Global
-
How we calculate our annual solar energy yield
-
We follow the global formula for estimating the electricity generated from a solar photovoltaic system, where the formula is:
E = A * r * H * PR
E = Energy (kWh)
A = Total solar panel area (m2)
R = Solar panel efficiency (%)
H = Annual average solar irradiance on tilted panels (shading not included)
PR = Performance ratio, coefficient of losses
-
Countries covered by the PVDATA Software:
-
The PVDATA software holds more than 100,000+ unique datasets. Of which, we cover every single geological location in all 96 countries listed. This means that users can structure a solar energy project/investment in any region, town, state, or community within the listed countries below:
Angola
Argentina
Armenia
Australia
Austria
Azerbaijan
Bangladesh
Belarus
Belgium
Bolivia
Botswana
Brazil
Bulgaria
Cambodia
Cameroon
Canada
Chile
China
Colombia
Costa Rica
Côte d Ivoire
Cyprus
Czech Republic
Denmark
Dominican Republic
Ecuador
Egypt
El Salvador
Ethiopia
Finland
France
Gabon
Germany
Ghana
Greece
Guatemala
Hungary
India
Indonesia
Israel
Italy
Japan
Jordan
Kazakhstan
Kenya
Kuwait
Latvia
Lebanon
Lithuania
Luxembourg
Madagascar
Malaysia
Mali
Mexico
Mongolia
Morocco
Mozambique
Namibia
Netherlands
New Zealand
Nigeria
Norway
Oman
Pakistan
Panama
Paraguay
Peru
Philippines
Poland
Portugal
Qatar
Romania
Russia
Rwanda
Saudi Arabia
Senegal
Sierra Leone
Singapore
Slovenia
South Africa
Spain
Sri Lanka
Sweden
Switzerland
Thailand
Togo
Turkey
Uganda
Ukraine
United Arab Emirates
United Kingdom
United States
Uruguay
Yemen
Zambia
Zimbabwe